Apr 28, 2026 | 812 words | 8 min read
9.3.2. Task 2#
Learning Objectives#
In this task, you will use MS Excel to automate calculations with absolute and relative cell referencing, import and organize data, and create professional visualizations. You will apply critical data analysis skills to evaluate measurements against specifications, identify outliers and errors, and synthesize findings into clear conclusions and recommendations.
Part A: Rocket Momentum#
Introduction#
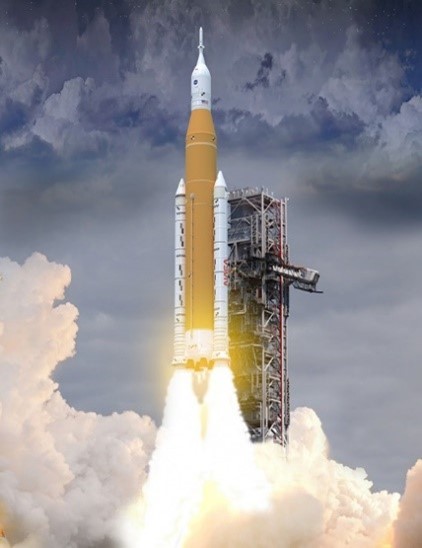
Fig. 9.8 Artemis I launch in Nov. 2022. (Dunbar)#
Rockets operate on the principle of conservation of momentum. Unlike most vehicles, a rocket’s mass continuously changes as it ejects fuel at high velocity to generate thrust. Because the mass is not constant, we cannot use the standard form of Newton’s Second Law (\(F = m \cdot a\)) to calculate the rocket’s acceleration and velocity (OpenStax, 2016). Instead, we use the Tsiolkovsky rocket equation, which accounts for the variable mass as fuel is burned.
In astrodynamics, the term \(\Delta V\), or “delta V”, represents the change in velocity needed to move between different points in space. The Tsiolkovsky rocket equation calculates the maximum \(\Delta V\) achievable based on the propellant exhaust velocity and the ratio of initial to final vehicle mass. Note that this is an idealized equation that neglects aerodynamic lift and drag.
where,
\(v_e\) = Propellant exhaust velocity (\({\meter\per\second}\)),
\(m_0\) = Initial total mass of vehicle (\(\kilo\gram\)),
\(m_1\) = Final total mass of vehicle (\(\kilo\gram\)),
and \(\ln\) is the natural logarithm.
A team of engineers is designing a space vehicle to launch into low-earth orbit. The team has a propellant with an exhaust velocity (\(v_e\)) of \(\qty{2000}{\meter\per\second}\) and a launch vehicle with an initial total mass (\(m_0\)) of \(\qty{10,000}{\kilo\gram}\). The team plans to use the Tsiolkovsky rocket equation to calculate \(\Delta V\) with this given propellant.
Task Instructions#
Given a space launch vehicle of known initial mass and propellant exhaust velocity, calculate the change in velocity of the rocket (\(\Delta V\)) necessary to reach a target orbit.
Open the answer sheet
ex1_ind_2a_username.xlsx. Save it with your Purdue username replacingusernamein the file name.In the Input Section of the sheet, enter the initial values for \(v_e\) in \({\meter\per\second}\) and \(m_0\) in \(\kilo\gram\).
Under the Calculation Section, populate Table 2.
In the first column, decrement the final total vehicle mass starting at \(\qty{10,000}{\kilo\gram}\) and going down to \(\qty{1,000}{\kilo\gram}\) by steps of \(\qty{100}{\kilo\gram}\). Use formula with relative cell referencing to decrement the values.
In the second column, calculate \(\Delta V\) in \({\meter\per\second}\) for each combination of final and initial vehicle mass. Use absolute and relative cell referencing to perform the calculations so the values of \(v_e\) and \(m_0\) could be changed, and the calculations will automatically update.
Copy the following questions into the Output Section of the spreadsheet and then add your answers.
If a \(\Delta V\) of \(\qty{2000}{\meter\per\second}\) is needed to get to low-earth orbit, what final vehicle mass will just get the vehicle there? Provide an estimate based on your calculations.
If a \(\Delta V\) of \(\qty{4500}{\meter\per\second}\) is needed to get to a geosynchronous orbit, what final vehicle mass will just get the vehicle there? Provide an estimate based on your calculations.
Save your spreadsheet as ex1_ind_2a_values_username.pdf displaying the values and as ex1_ind_2a_formulas_username.pdf displaying the formulas.
Part B: Viscosity Quality Control#
Introduction#
A quality control engineer at a company that produces engine oil for race cars must validate product viscosity against specifications of \([0.475, 0.525]~\unit{\pascal\cdot\second}\). Some customers have reported that the product viscosity falls outside these specifications. The engineer has collected viscosity measurements from the production line at \(50\) evenly spaced time intervals, with the results stored in a text file.
Task Instructions#
Help analyze the viscosity data and present findings, conclusions, and recommendations to the engineering team.
Open the answer sheet
ex1_ind_2b_username.xlsx. Save it with your Purdue username replacingusernamein the file name.In the Input Section of the sheet, import the data from the file
ex1_ind_2b_viscosity.txt.Under the Calculation Section,
Compute the number of data points within and outside the specifications. Use built-in functions of MS Excel to calculate these values.
Based on the values computed in the previous step, compute the percentage of values within specifications.
Create 2 plots in the Figure Section of the spreadsheet:
Plot the measurements of viscosity at \(50\) evenly spaced time intervals.
Plot the measurements of viscosity at \(50\) evenly spaced time intervals with horizontal lines indicating the upper and lower specification limits.
Copy the following questions into the Output Section of the spreadsheet and then add your answers.
Does the data appear to have outliers or errors in measurement? Why or why not?
What percentage of the measurements meet the specification of being within \([0.475, 0.525]~\unit{\pascal\cdot\second}\)?
Given your answer to the previous question, and your plot, summarize the engineer’s main message to the engineering team about the process.
Save your spreadsheet as ex1_ind_2b_values_username.pdf displaying the values and as ex1_ind_2b_formulas_username.pdf displaying the formulas.
Deliverables#
You may seek help on individual tasks from classmates, the instructional team, or others but the work that you submit should always be your own.
If you collaborate with others and use information developed together or by someone else, ALWAYS document and reference that material.
Upload all deliverables to Gradescope as a single submission.
Deliverables |
Description |
|---|---|
ex1_ind_2a_values_username.pdf |
PDF of your MS Excel document with values showing. |
ex1_ind_2a_formulas_username.pdf |
PDF of your MS Excel document with formulas showing. |
ex1_ind_2b_values_username.pdf |
PDF of your MS Excel document with values showing. |
ex1_ind_2b_formulas_username.pdf |
PDF of your MS Excel document with formulas showing. |