Dec 04, 2025 | 811 words | 8 min read
11.2.1. Task 1#
Learning Objectives#
Load a user specified image as an array and display it.
Task Instructions#
Save the flowcharts for this task in tp1_team_1_teamnumber.pdf You will also need to include these flowcharts in your final report.
Write Python code that loads a user specified image and prepares it for feature extraction. Ensure that the image is converted to the correct format (RGB or Grayscale) and the pixel values are properly scaled for processing. If the image is in RGBA mode, convert it to RGB before returning it as a 3 channel NumPy array. If the image is in Grayscale mode, return it as a single channel NumPy array.
For this checkpoint, please revisit Section 10.1.1 and read the documentation links thoroughly. You will need to use the PIL library to load and manipulate images, and the matplotlib.pyplot library to display images.
Name this program tp1_team_1_teamnumber.py.
Step 1: Image Loading Function#
Create a function named load_img
Arguments:
path (str): The file path of the image to be loaded
Returns:
img_array (NumPy array): The NumPy array representing the normalized RGB/Grayscale image
Your function must load the user specified image using PIL.image.open and convert it to an array as you did in Section 10.3.1.
Color images should have 3 channels (Red, Green, Blue), while grayscale images should have only one channel. For this, you must check the shape of each image, if the format is RGBA, discard the 4th channel to make it RGB. After conversion, you must ensure that the pixel values are properly scaled for processing as described below.
Images are typically loaded in a format that represents each pixel’s values, either as integers in the range [0-255] or normalized floating-point values [0.0-1.0]. For feature extraction in checkpoint 2, you need pixel values to be integers in the range [0-255].
For this task, your function should first normalize all pixels so that the values are between [0.0-1.0] (if not already in this range). Next, linearize the pixel intensities as you did in Section 10.3.1. That is, for each pixel, apply the following transformation:
Note
RGB images need each channel (R, G, B) of each pixel to be linearized separately. Grayscale images only have one channel to linearize.
For feature extraction in the next tasks, you need pixel values to be integers in the range [0-255].
So, scale them back to the range [0-255] and set the data type to unsigned 8-bit integers (np.uint8, see the docs). You can read about some different NumPy data types here
Hint
You can check the data type of a NumPy array using the .dtype attribute. For example, if arr is a NumPy array, you can get its data type by accessing arr.dtype.
Ask a TA or ChatGPT: Why do we want to scale values to 0-255 to store them as 8-bit integers?
Step 2: Grayscale Conversion Function#
Create a function named rgb_to_grayscale
Arguments:
img_array (NumPy array): The NumPy array representing the loaded RGB image
Returns:
gray_array (NumPy array): The NumPy array representing the Grayscale image after conversion
The function should use the ITU-R Recommendation BT.709 standard for grayscale conversion:
\(Y = 0.2126 \times R + 0.7152 \times G + 0.0722 \times B\)
Here, \(Y\) is the resulting grayscale intensity, and \(R\), \(G\), and \(B\) are the linearized values of the red, green, and blue channels, respectively. The weights correspond to the relative importance of each channel in human vision.
Note
You may need to change the data type of the input array to floating-point to avoid overflow during calculations. After computing the grayscale intensity values, ensure that the output is converted back to unsigned 8-bit integers.
Be sure to apply this formula to each pixel in the image array to produce the grayscale output.
Ensure that the grayscale result is stored as unsigned 8-bit integers in the range [0, 255]. Note that the array this function returns should only have 2 dimensions (height, width) since it is a single channel grayscale image.
Step 3: Main Function#
In your main function:
Ask the user for an image file path. Then, call the
load_imgfunction with the path to load the image into an array.After loading the image, if the image is a color image, ask the user if they wish to convert it to grayscale. If yes, call the
rgb_to_grayscalefunction to convert it to grayscale.Display the image to the user (see the docs).
Note
Grayscale images are displayed back with a colormap by default. You can use the cmap argument in the imshow function to display it correctly. Read more about cmap in the docs.
Organize your code to use functions as explained above to break up the task into manageable pieces. Use the files provided in the Table 11.3 to test your code.
Image File Name |
Description |
|---|---|
A color image |
|
A grayscale image |
Ensure that your outputs match the examples below.
Sample Output#
Use the values in Table 11.4 below to test your program.
Case |
image_path |
|---|---|
1 |
ref_col.png |
2 |
ref_gry.png |
3 |
ref_col.png |
Ensure your program’s output matches the provided samples exactly. This includes all characters, white space, and punctuation. In the samples, user input is highlighted like this for clarity, but your program should not highlight user input in this way.
Case 1 Sample Output
$ python3 tp1_team_1_teamnumber.py Enter the path of the image you want to load: ref_col.png Would you like to convert to grayscale? no
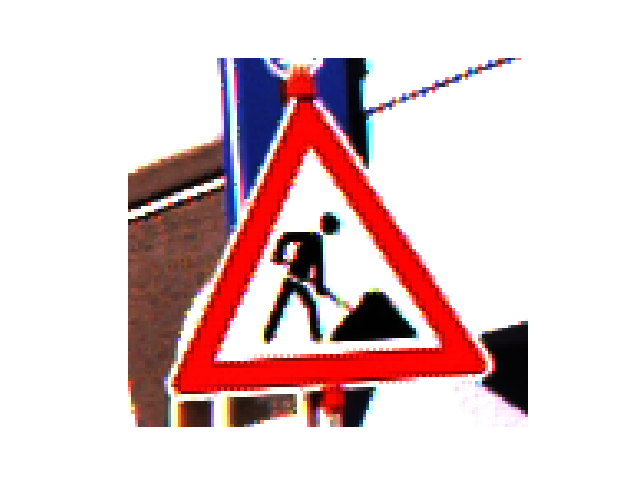
Fig. 11.1 Case_1_output_ref_col.png#
Case 2 Sample Output
$ python3 tp1_team_1_teamnumber.py Enter the path of the image you want to load: ref_gry.png
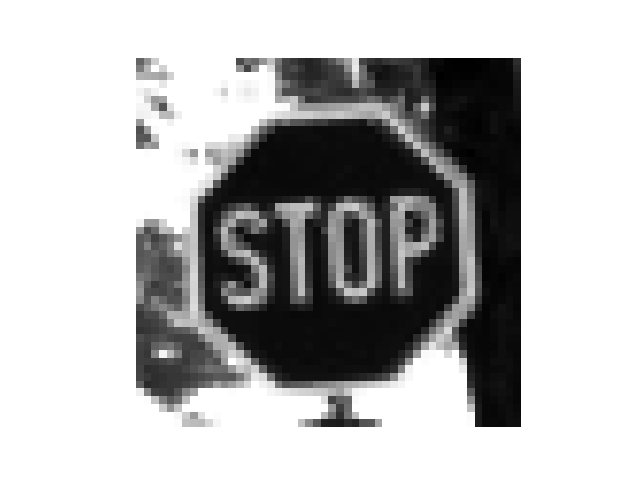
Fig. 11.2 Case_2_output_gray_ref_gry.png#
Case 3 Sample Output
$ python3 tp1_team_1_teamnumber.py Enter the path of the image you want to load: ref_col.png Would you like to convert to grayscale? yes
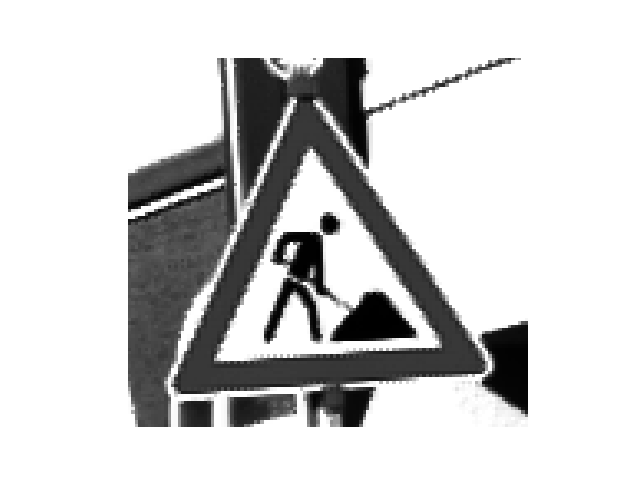
Fig. 11.3 Case_3_output_gray_ref_col.png#
Deliverables |
Description |
|---|---|
tp1_team_1_teamnumber.pdf |
Flowchart(s) for this task. |
tp1_team_1_teamnumber.py |
Your completed Python code. |